

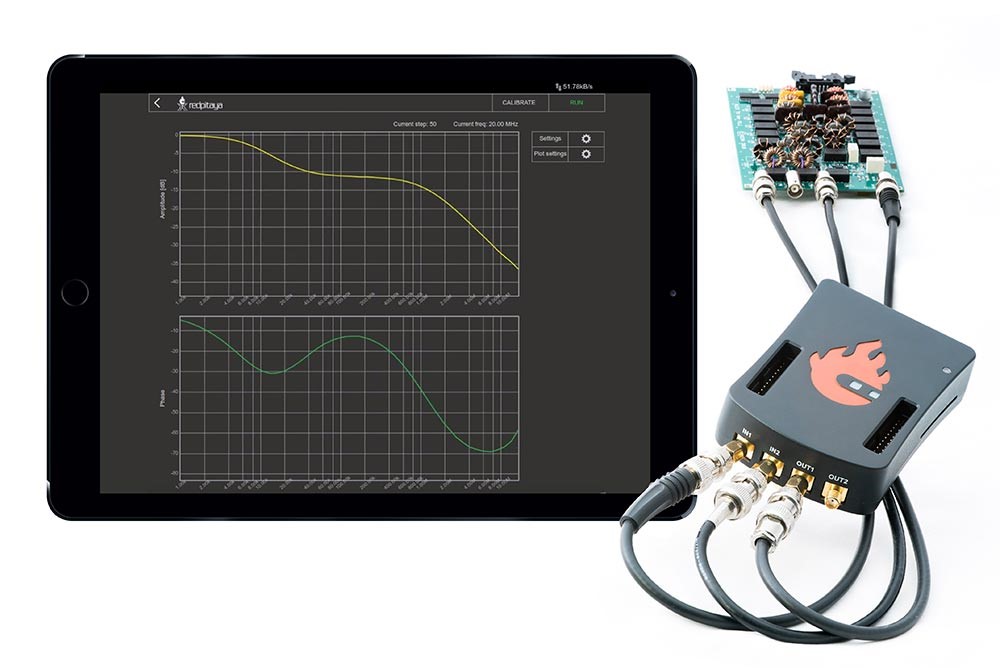
This application will turn your Red Pitaya board into an affordable Bode analyzer. It is the perfect tool for educators, students, makers, hobbyists and professionals seeking affordable, highly functional test and measurement equipment. The Bode analyzer is an ideal application for measuring the frequency responses of the passive/active filters, complex impedances and any other electronic circuit. The Gain/Phase frequency response can be used to completely characterize any device being tested, with both linear and logarithmic sweeps. Gain and Phase can be measured from 1Hz to 20MHz. The basic user interface enables quick interaction and parameter setting. The Bode analyzer can be used for the measurement of the stability of control circuits such as the DC/DC converters in power supplies, and the influence of termination on amplifiers or filters, ultrasonic and piezo electric systems and similar. All Red Pitaya applications are web-based and do not require the installation of any native software. Users can access them via a browser using their smartphone, tablet or a PC running any popular operating system (Mac, Linux, Windows, Android and iOS).
The graphical user interface of the Bode analyzer application is shown below.
The graphical interface is divided into five areas:
- Stop/Run button: It is used to start and stop measurement. Calibrate button: When the selected calibration of the setup is started.
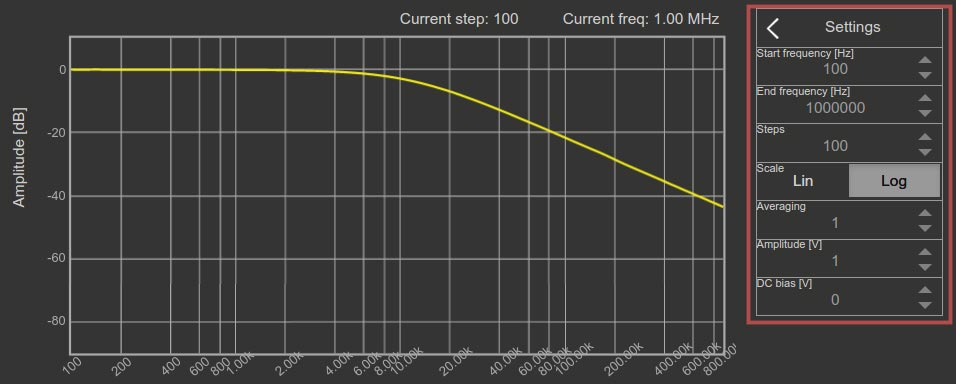
- Measurement settings panel: It is used for to set the measurement parameters such as the frequency range, scale, number of steps, excitation signal amplitude, excitation signal DC bias and averaging number.
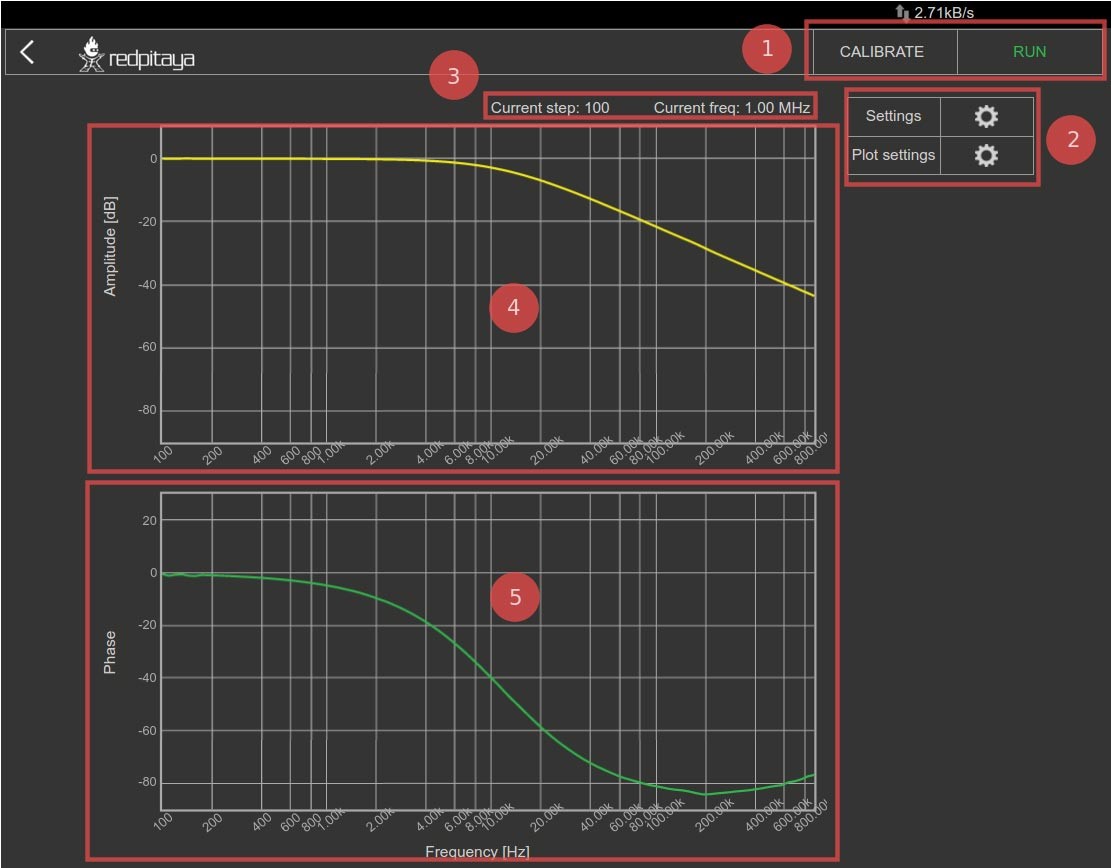
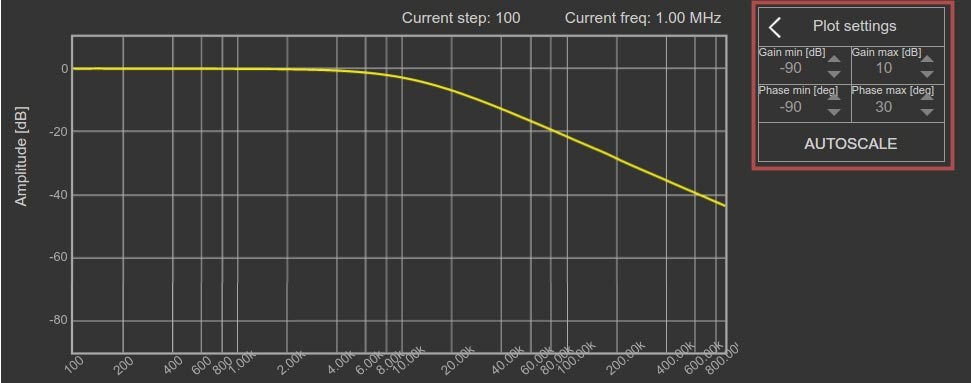
- Plot settings panel: It is used to set the Gain and Phase graph ranges, and also the manual or auto scale modes.
- Gain graph: The Gain frequency response of the DUT (device under test) is plotted for the selected frequency range.
- Phase graph: The Phase frequency response of the DUT is plotted for the selected frequency range.
| STEMlab 125-10 | STEMlab 125-14 | SIGNALlab 250-12 | |
| Frequency span | 1Hz-20MHz | 1Hz-20MHz | 1Hz-20MHz |
| Frequency resolution | 1Hz | 1Hz | 1Hz |
| Excitation signal amplitude | 0 – 1 V | 0 – 1 V | 0 – 1 V |
| Excitation signal DC bias | 0 – 0.5 V | 0 – 0.5 V | 0 – 0.5 V |
| Resolution | 10bit | 14bit | 12bit |
| Maximum number of steps per measurement | 1000 | 1000 | 0 – 0.5 V |
| Maximum input amplitude | +/- 1 V or +/- 20 V * | +/- 1 V or +/- 20 V * | +/- 1 V or +/- 20 V * |
| Measured parameters | Gain, Phase | Gain, Phase | Gain, Phase |
| Frequency sweep modes | Linear/Logarithmic | Linear/Logarithmic | Linear/Logarithmic |
*Set by jumpers
**Set by software

Oscilloscope &
Signal generator
Spectrum analyzer
Bode analyzer
Logic analyzer basic
LCR meter
Vector network analyzer
LabView
Control STEMlab with LabVIEW - software designed for the fast development of any engineering application that requires test, measurement, or control.
MATLAB
Control your Red Pitaya with MATLAB - the easiest and most productive software environment for engineers and scientists. Perfect combination to speed up your research, prototyping and testing.
Jupyter / python
Jupyter notebooks is an open-source web application that combines live Python code, equations, visualizations, dashboards with real time graphs, dials, meters, sliders, buttons and explanatory text.