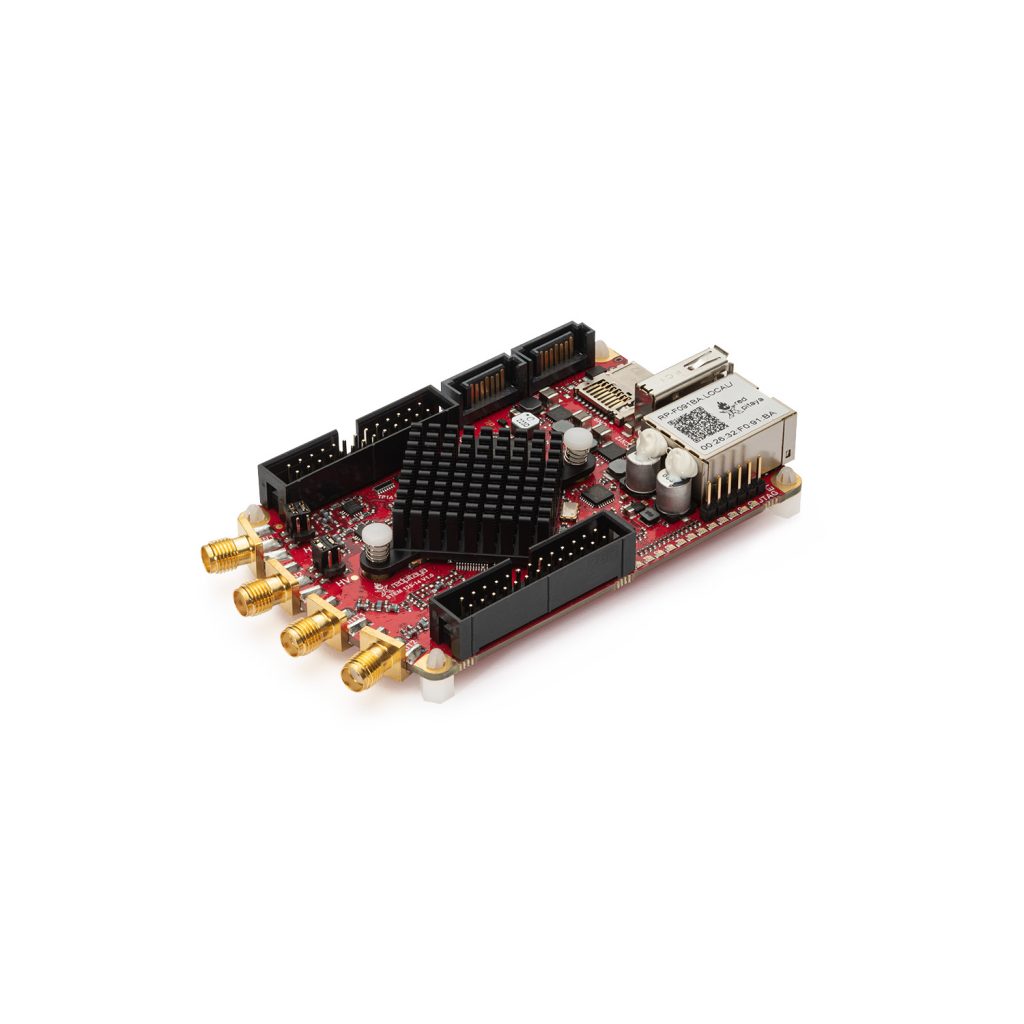
Logic analyzer
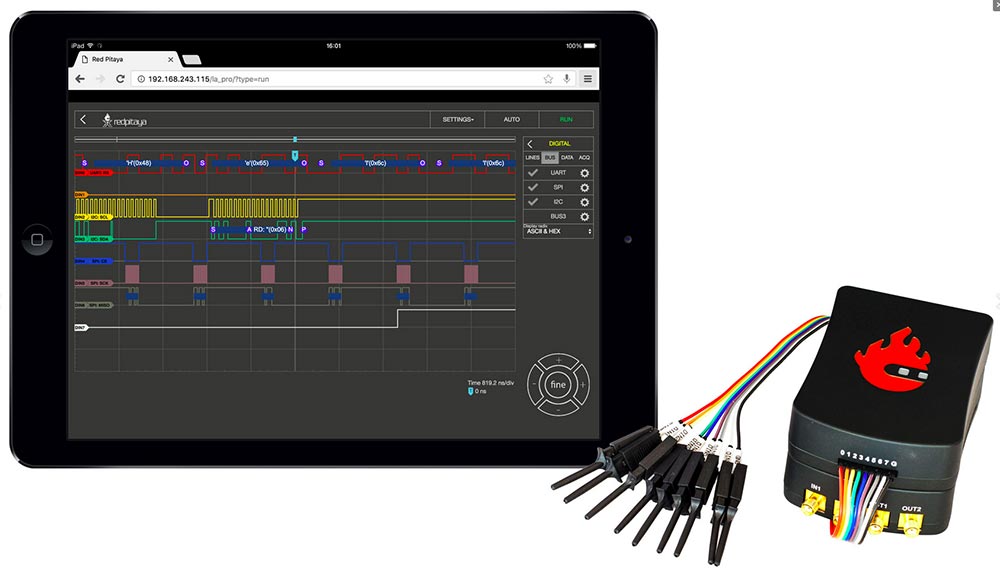
The Logic Analyzer application enables the representation of the binary states of digital signals. The Logic Analyzer can both deal with purely binary signals, such as the GPIO outputs of the Raspberry Pi or Arduino board, as well as analyze different bus protocols (I2C, SPI, and UART) and decode the transmitted data. All Red Pitaya applications are web-based and do not require the installation of any native software. Users can access them via a web browser using their smartphone, tablet or a PC running any popular operating system (Mac, Linux, Windows, Android, and iOS).
Logic Analyzer application possibilities:
-
Logic Analyzer Probes – Without the Logic Analyzer extension module – Directly use the GPIO expansion connector of the STEMLab board. Compatible with the STEMlab 125-10 only!
-
Logic Analyzer Extension Module – Enables different logic levels, board protection and higher performance. Compatible with STEMlab 125-10/14 or 122.88-16 board!
The graphical user interface of the Logic Analyzer fits well into the overall design of the Red Pitaya applications, providing the same operating concept. The Logic Analyzer user interface is shown below.
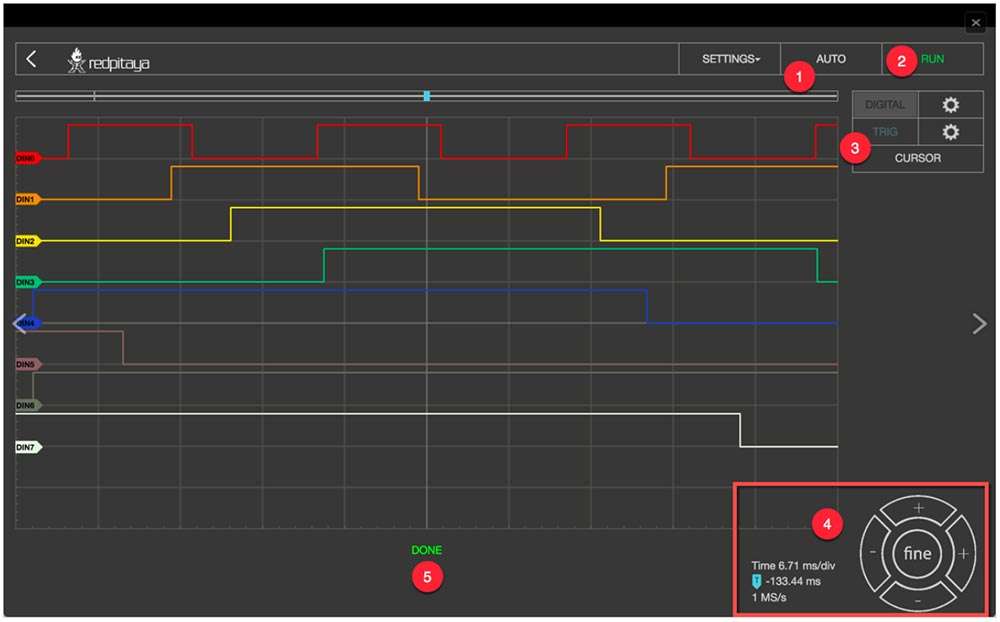
Apart from the actual graph, there are again five key areas/elements into which the surface is divided:
-
Auto: Resets the zoom and brings the trigger event into the middle of the graph.
-
Run / Stop: Starts recording the input signals, and interrupts them when the recording is active.
-
Channels / Trigger / Measuring Tools: This menu provides controls for inputs, triggers, and guides.
-
Axis Control Panel: The horizontal +/- buttons enable you to select the scaling of the X–axis and to change it, and select the time range displayed in the graph. The vertical +/- buttons change the Y–axis, and thus the height of the graph display. In addition, the setting for the time frame, trigger and sampling rate are displayed.
-
Status Display: Displays information about the current state of the recording (stop, wait, ready).
Basic Logic Analyzer | Logic Analyzer PRO | |
Channels | 8th | 8th |
Sampling rate (max.) | 12ms/s | 125ms/s |
Maximum input frequency | 3MHz | 50MHz |
Supported bus protocols | I2C, SPI, UART | I2C, SPI, UART |
Input voltage | 3.3V | 2.5 … 5.5V |
Overload protection | – | integrated |
Level thresholds | – | 0.8V (low) |
Input impedance | – | 100k, 3 pF |
Trigger types | Level, edge, pattern | Level, edge, pattern |
Memory depth | 1 MS (typical) | 1 MS (typical) |
Sampling interval | 84ns | 8ns |
Minimum pulse duration | 100ns | 10ns |

Hardware/Connections
Further hardware and connections can be used in addition to the Logic Analyzer application for maximum performance and protection of your STEMLab board. Using the LA extension module is straightforward, just plug it into your STEMLab and connect the leads to the desired measurement points.
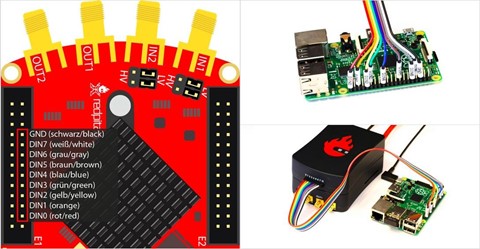
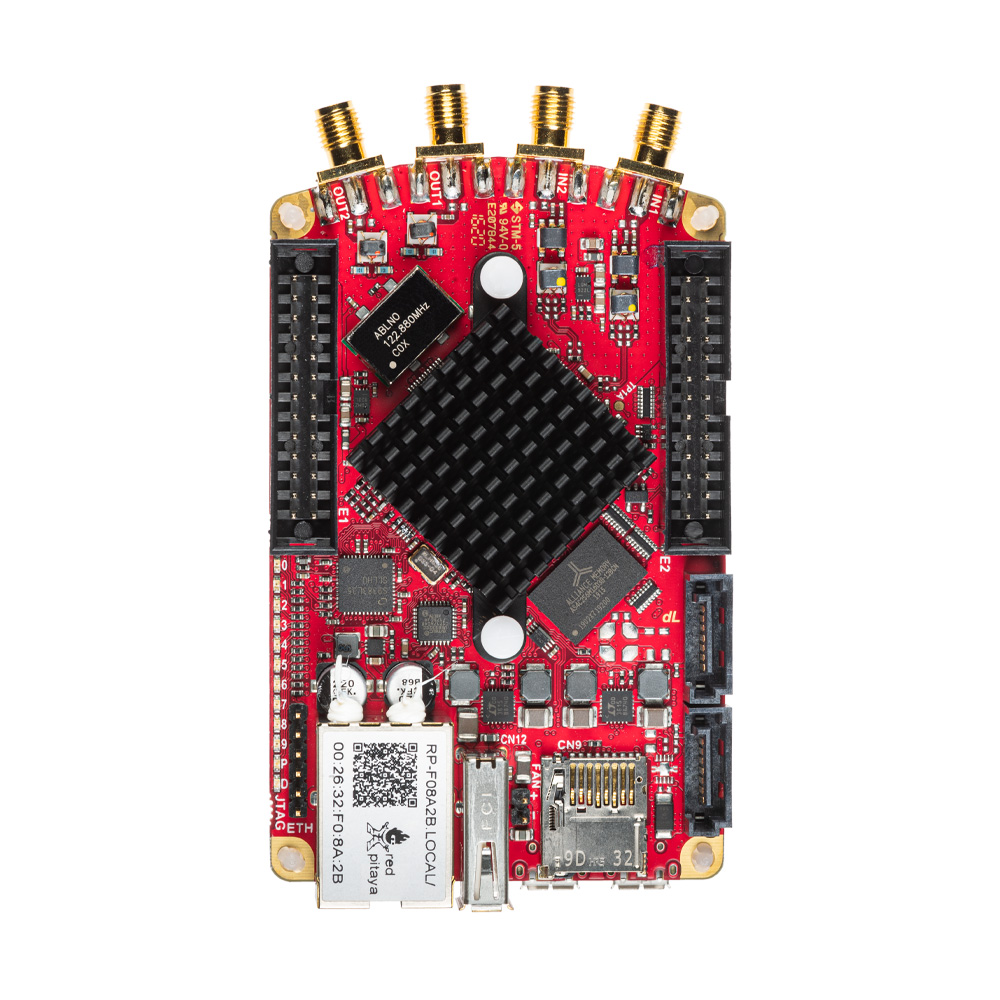
If you are using the Logic Analyzer without the extension module (Logic Analyzer Basic), then you need to be more careful in connecting the Logic Analyzer probes to the extension connector E1 on the Red Pitaya board.
Note: Directly using the GPIO expansion connector E1 pins of the Red Pitaya board only works with the STEMlab 125-10!
ANALYZING BINARY SIGNALS:
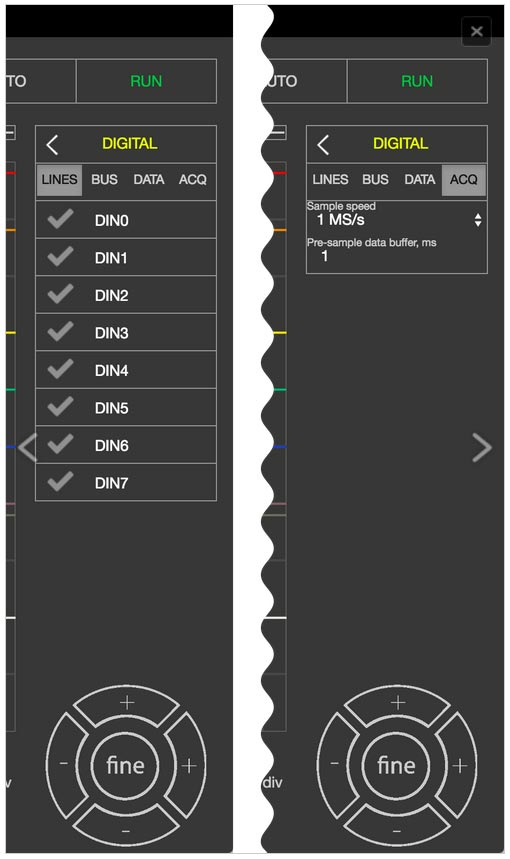
By selecting the gear button behind the DIGITAL selection field you enter the menu for the channel configuration. In the LINES register, the channels can be activated or deactivated by simply clicking the check mark. As long as no bus systems have been configured, the channels operate as purely digital inputs and show the corresponding progress. The tab ACQ opens the selection field for the sample rate settings. When selecting the values there is one thing to note: the sample rate has a significant influence on the time section, which can be represented. The memory depth of the Logic Analyzer applications is 1 MS, so it can store and display 1,000,000 binary values. From this it is clear that the sampling rate determines how many values are recorded per second. If we choose the highest sampling rate (125MS/s), 125,000,000 values would be recorded per second. Since 1,000,000 values can be stored is the time memory, we get a 0.008 second time window. With a sampling rate of 1MS/s, the time window of the recorded signal will be one full second.
A pre-sample data buffer value can be set with regard to the point in the recording where the trigger event is located. This makes particular sense if you want to find out what happened before the defined trigger event. To illustrate with an example: the sample rate is set at 4MS / s, the stored time segment thus amounts to approximately 0.25s = 250ms. If the pre-sample data buffer is set to 10ms, then the recorded signal shows what has happened 10ms before the event, and 240ms after the event.

TRIGGER:
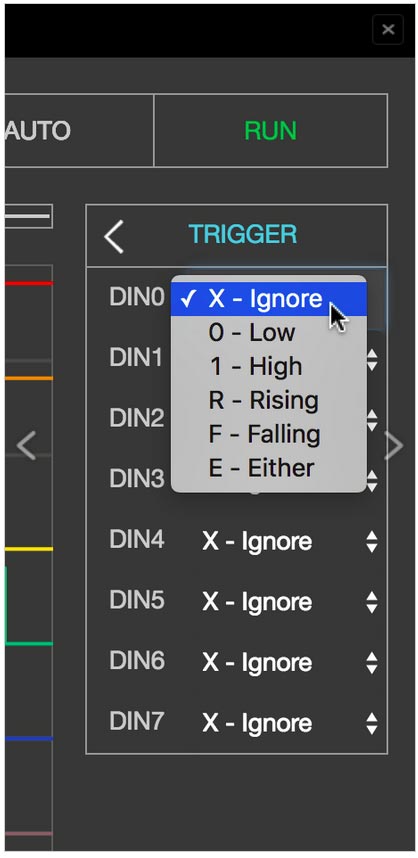
By clicking the gear behind TRIG settings, the trigger menu is opened. Each channel can be set as a trigger source with the desired condition. For acquisition to start, the Trigger source and Rising Edge need to be defined.
The possible criteria for a Trigger event are as follows:
X – Ignore no event
R – Rising edge
F – Falling edge
E – Edge change (rising or falling edge)
By clicking the RUN button the recording is started. The status display informs you whether the process is still running (WAITING) or has already been completed (DONE). After finishing the acquisition, the results are displayed in a graph. Additional trigger options LOW and HIGH are used for the so-called Patterned triggering. For example: if you set the trigger source to be DIN0 – Rising edge (to have one channel defined as a trigger source with a rising or falling edge is a mandatory condition for the acquisition to start), DIN1 to HIGH and DIN2 to LOW, this will cause such a behavior that the application logic analyzer will wait for the state where DIN0 goes from 0 to 1, DIN1 is 1 and DIN2 is 0 to start the acquisition.
DECODE BUS DATA:
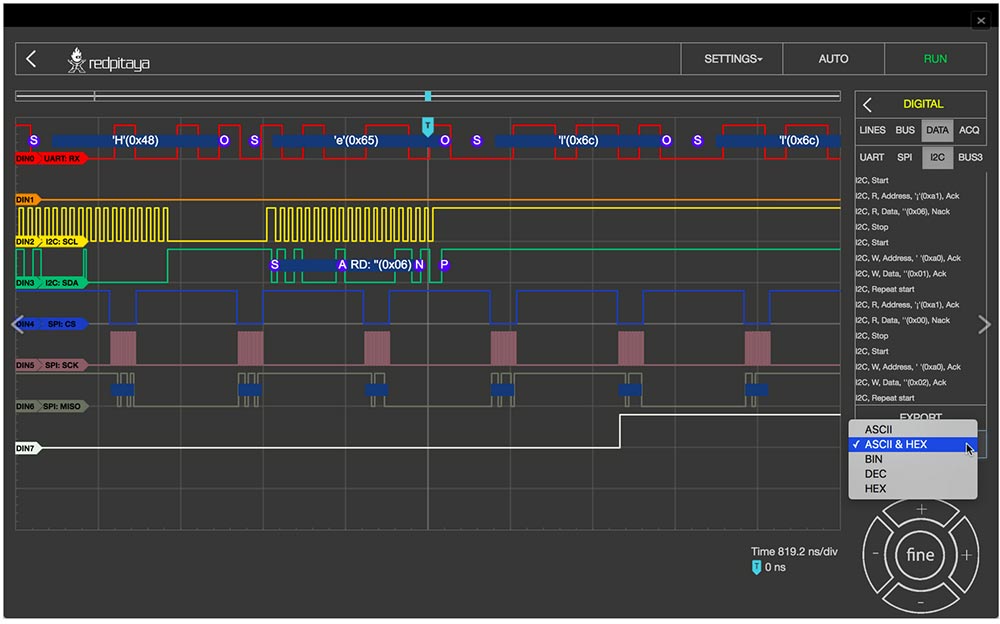
In the DIGITAL → BUS menu the decoding of the desired lines can be selected. Up to four buses can be defined. The available decoding protocols are I2C, UART, and SPI. By selecting the desired protocol, the setting menu for the selected protocol is opened.

Two options are possible for the display of the decoded data: firstly, the data is placed as a separate layer in the graph directly on the signal. Secondly, using the DIGITAL → DATA menu where the decoded data are represented in a table format. You can select ASCII, DEC, BIN and HEX data formatting. With the EXPORT button the decoded data can be packed into a CSV file. This then ends up directly in the download folder and can be used for further analysis.
CURSORS:
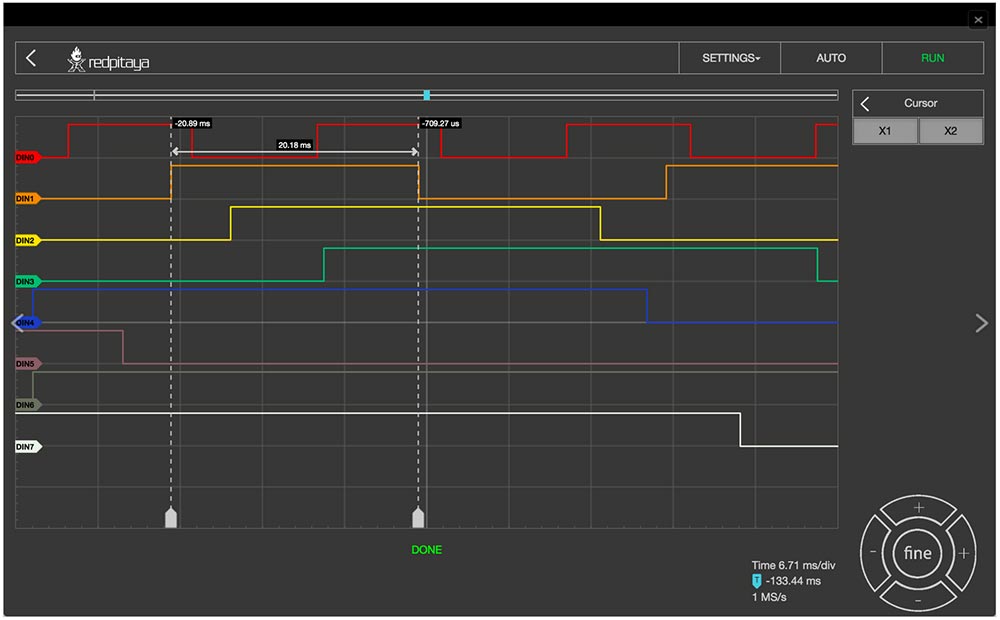
As with the Oscilloscope the Logic Analyze application also provides CURSORS for quick measurements. Because there are no variable amplitude readings but only discrete signal levels, the cursors are available exclusively for the X-axis. When enabled, the cursors will show the time relative to the zero point (trigger event) and the difference between the two.
SHOP PRODUCTS
Development tools
The platform software is Open Source and available on Github. Device functionalities and data can be accessed through Matlab, Labview, Scilab and Python API’s.
LabView
Control STEMlab with LabVIEW - software designed for the fast development of any engineering application that requires test, measurement, or control.
MATLAB
Control your Red Pitaya with MATLAB - the easiest and most productive software environment for engineers and scientists. Perfect combination to speed up your research, prototyping and testing.
Jupyter / python
Jupyter notebooks is an open-source web application that combines live Python code, equations, visualizations, dashboards with real time graphs, dials, meters, sliders, buttons and explanatory text.
Explore Red Pitaya Resources
Our team constantly works on enriching our information base which makes your experience with Red Pitaya better. Check out the documentation, teaching materials and case studies and start your Red Pitaya journey!
Documentation
Find the information about getting started, more about applications and the developer's guide here.
Teaching materials
Explore our library of step-by-step examples, video tutorials and advanced FPGA excercises.
