Spectrum analyzer
This application will turn your Red Pitaya board into a 2-channel DFT spectrum analyzer. It is the perfect tool for educators, students, makers, hobbyists and professionals seeking affordable, highly functional test and measurement equipment. The DFT spectrum analyzer application enables fast and powerful spectrum analysis using a DFT algorithm. The frequency span is from DC up to 62.5MHz, where the frequency range can be arbitrarily selected. You can easily measure the quality of your signals, signal harmonics, spurious signals and power. All Red Pitaya applications are web-based and do not require the installation of any native software. Users can access them via a web browser using their smartphone, tablet or a PC running any popular operating system (Mac, Linux, Windows, Android, and iOS). The elements on the DFT spectrum analyzer application are arranged logically and offer a familiar user interface.


The graphical interface is divided into four main areas:
- Run/Stop and Export button: The “Run/Stop” button is used to start and stop measurements. With the “Export” button you can select in which format you want to download the measured data (plotted spectrum). Two formats are available: .png and .csv.
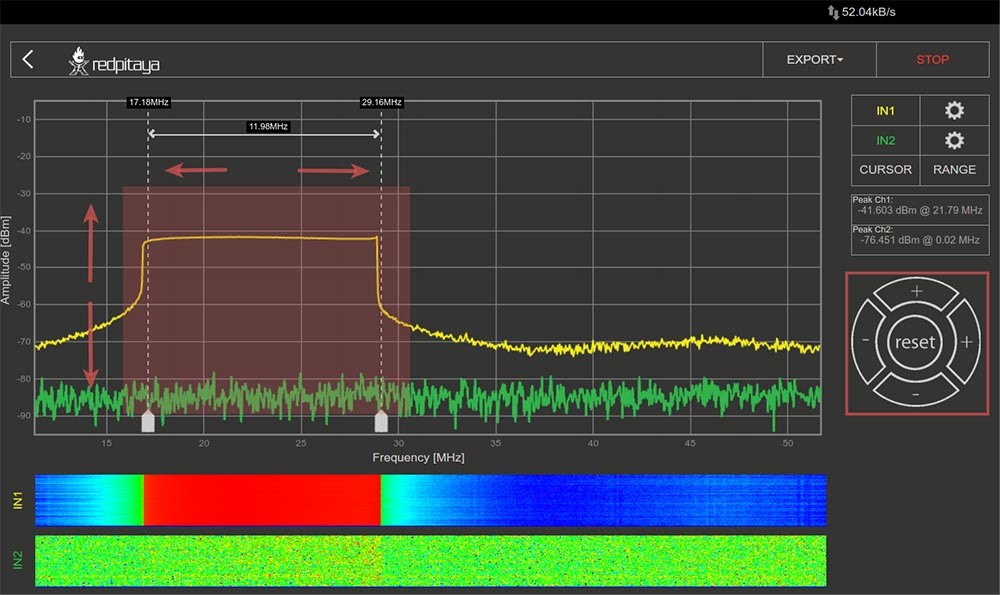
- Inputs / Cursors / Range / Axis control panel: This menu provides controls for inputs, cursors, and frequency range settings. Horizontal +/- buttons are used to select the span of the X (frequency) axis (zooming in/out). The vertical +/- buttons change the Y (amplitude) axis range.
- Graph area: Here, the currently calculated signal spectrum is plotted in the selected frequency range.
- Waterfall plots: Waterfall plots are a different form of signal spectrum representation, where the color on the plot defines the signal amplitude for a certain frequency. The waterfall plot is useful to enable the representation of a signal spectrum in a time dependency.
| STEMlab 125 – 10 | STEMlab 125 – 14 | SDRlab 122-16 | SIGNALlab 250-12 |
Input channels | 2 | 2 | 2 | 2 |
Bandwidth | 0 – 50MHz | 0 – 62MHz | 300kHz – 62MHz | 0 – 62MHz |
Resolution | 10 bit | 14 bit | 16 bit | 12 bit |
DFT buffer | 16384 | 16384 | 16384 | 16384 |
Dynamic range | 70 dBm | 80 dBm | 96 dB | 74 dB |
Input range | 10dBm | 10dBm | 4dBm | 10dBm |
Input impedance | 1 MΩ / 10 pF | 1 MΩ / 10 pF | 50 ohm | 1 MΩ / 10 pF |
Input coupling | DC | DC | DC | DC |
Spurious frequency components | 70 dBFS Typically | 90 dBFS Typically | 90 dBFS Typically | 90 dBFS Typically |
The main features of the DFT spectrum analyzer are described below:
INPUTS:
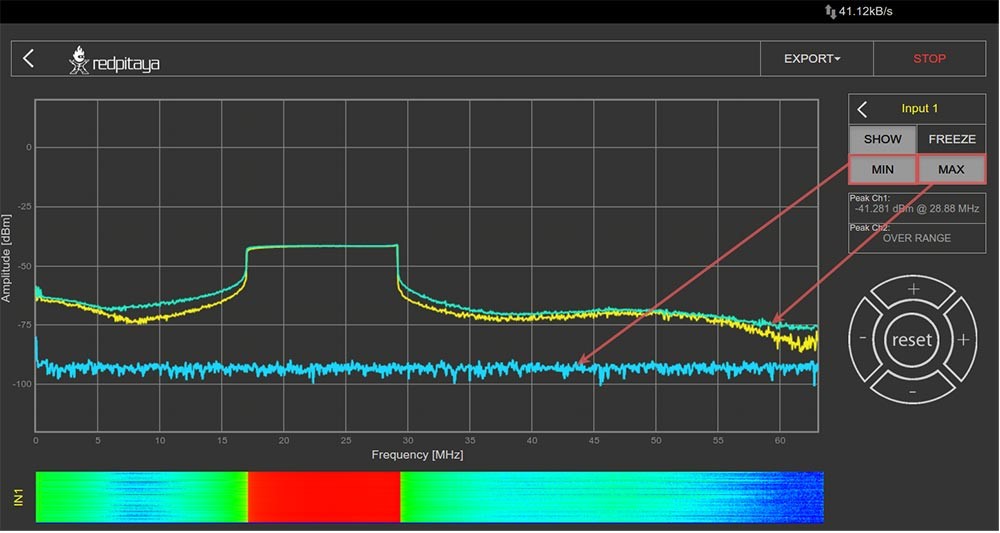
Input controls are shown in the picture below. With the “SHOW” select button displaying the spectrum of the selected input can be enabled or disabled. The “FREEZE” button is used for stopping the measurements of the selected input. The “MIN” and “MAX” select buttons are used to enable/disable the persist mode for the spectrum plot. The “MIN” signal spectrum plot will show the lowest values of the signal spectrum taken after enabling the “MIN” button. The same logic is used for the “MAX” signal where the MAX values of the signal spectrum are shown. This feature is mostly used for detecting signal glitches and the max/min spectrum amplitude values during the measurement.
CURSORS:
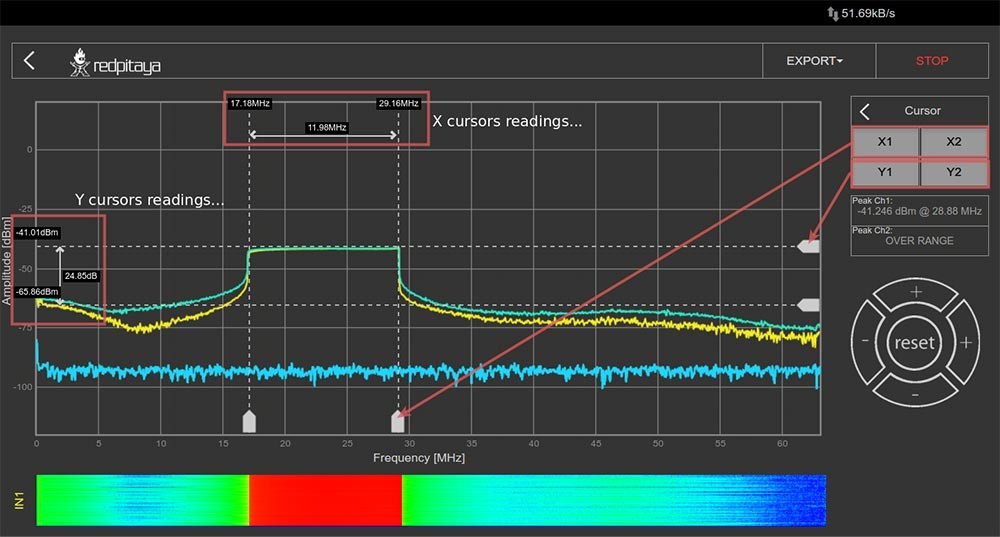
The cursors are an additional vertical and horizontal pair of lines useful for extracting the values of the spectrum plots.
The cursors are interactive and they can be set on any part of the graph while the frequency value is shown corresponding to the place where the X cursors are set, and the amplitude value where the Y cursors are set. Cursor delta values are useful for measuring signal harmonics and relative ratios between amplitudes and frequencies.
RANGE:
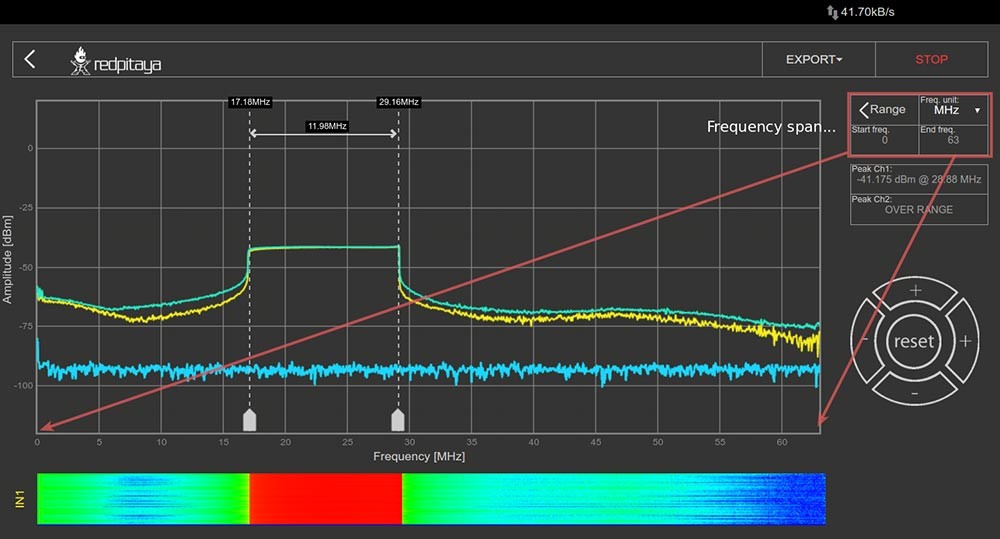
The range settings are used to set a frequency span. This feature is useful when the frequency range of interest is smaller than the full frequency range of the spectrum analyzer application.
PEAK DETECTION:
During the measurement, peak values of the signal spectrum are measured and shown on the “Peak Values” field. Peak values are max values of the signal spectrum regardless of the selected frequency range. Peak detection prevents not seeing peak values which are outside the selected frequency span.
WATERFALL PLOTS:
Waterfall plots are a different form of signal spectrum representation where the color on the plot defines the signal amplitude for a certain frequency. The waterfall plot is useful when enabling the representation of the signal spectrum in a time dependency.
AXIS CONTROLS:
Horizontal +/- buttons are used to select the span of the X (frequency) axis (zooming in/out). The vertical +/- buttons change the Y (amplitude) axis range. The reset button resets the frequency and amplitude span to the default values.
SHOP PRODUCTS
Development tools
The platform software is Open Source and available on Github. Device functionalities and data can be accessed through Matlab, Labview, Scilab and Python API’s.
LabView
Control STEMlab with LabVIEW - software designed for the fast development of any engineering application that requires test, measurement, or control.
MATLAB
Control your Red Pitaya with MATLAB - the easiest and most productive software environment for engineers and scientists. Perfect combination to speed up your research, prototyping and testing.
Jupyter / python
Jupyter notebooks is an open-source web application that combines live Python code, equations, visualizations, dashboards with real time graphs, dials, meters, sliders, buttons and explanatory text.
Explore Red Pitaya Resources
Our team constantly works on enriching our information base which makes your experience with Red Pitaya better. Check out the documentation, teaching materials and case studies and start your Red Pitaya journey!
Documentation
Find the information about getting started, more about applications and the developer's guide here.
Teaching materials
Explore our library of step-by-step examples, video tutorials and advanced FPGA excercises.
