Oscilloscope & Signal generator
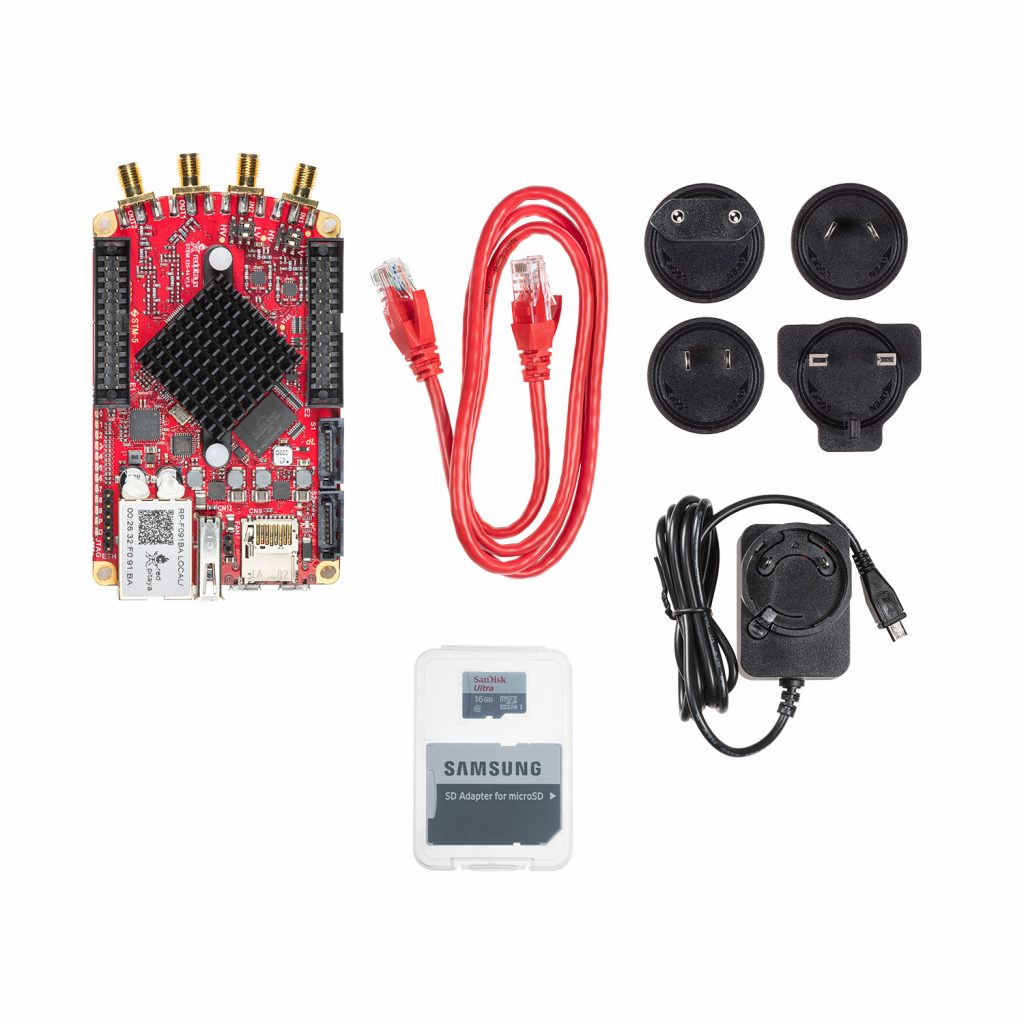
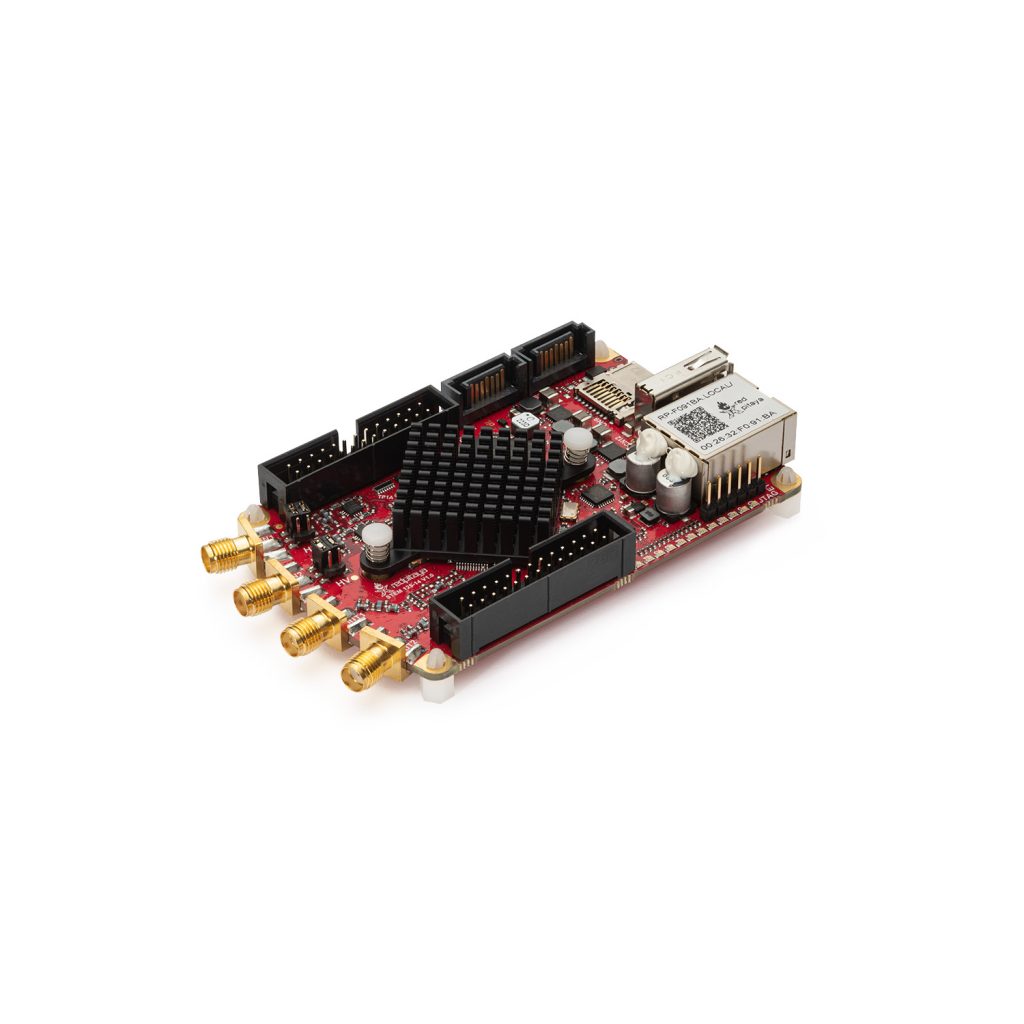
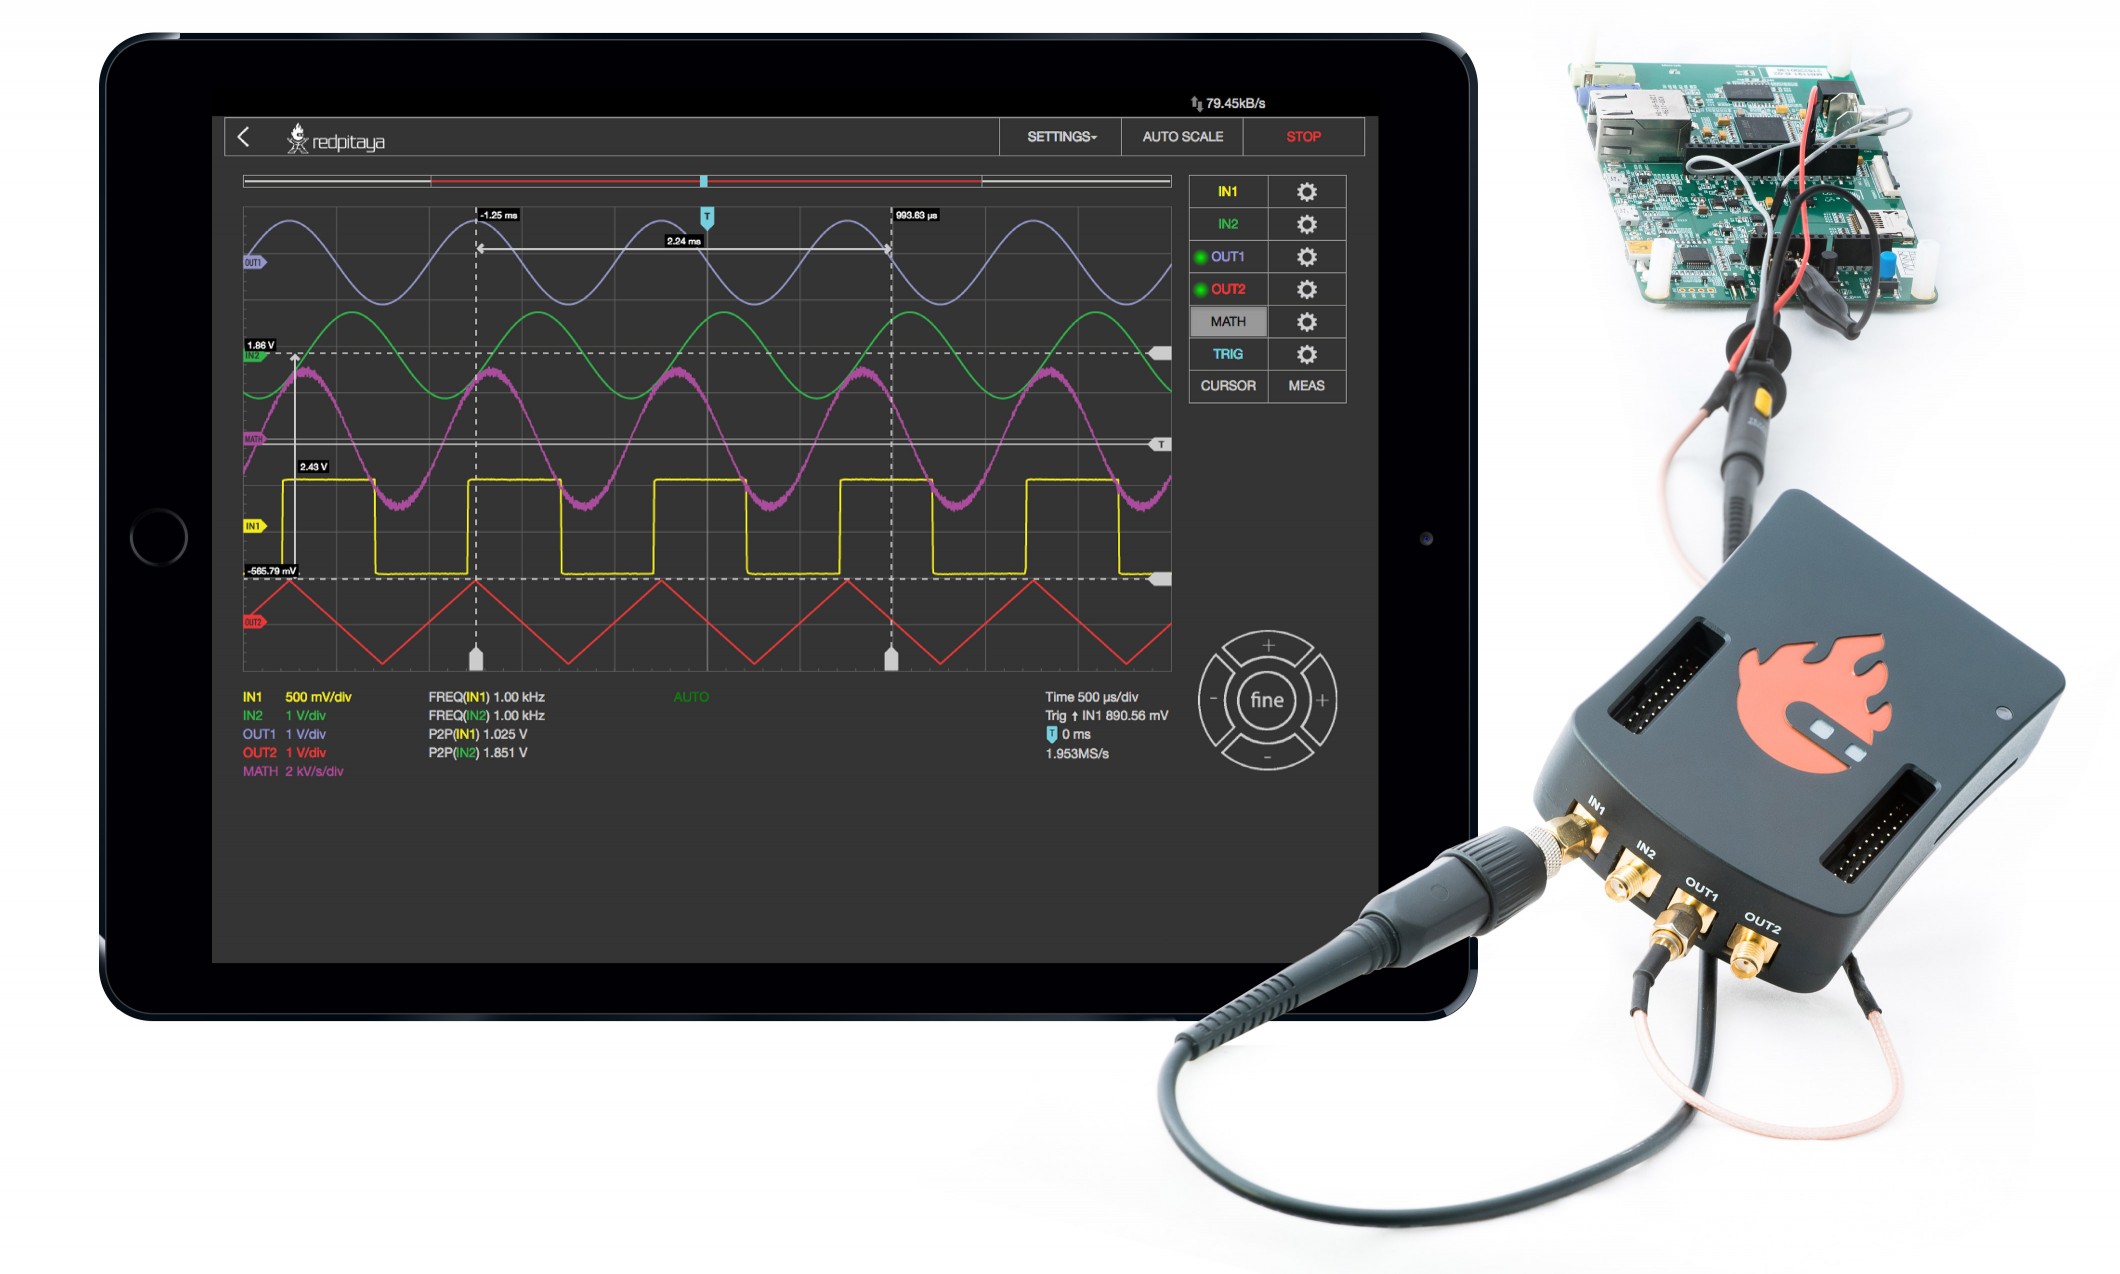
The Oscilloscope & Signal Generator application will turn your Red Pitaya board into a 2-channel Oscilloscope and 2-channel Signal Generator. It is the perfect tool for educators, students, makers, hobbyists and professionals seeking affordable, highly functional test and measurement equipment. It enables generating and measuring electrical signals up to 50MHz. The simple and intuitive user interface provides all the necessary tools for signal analysis and measurements. High-end specifications will satisfy more demanding users looking for powerful tools for their work benches. The application is web-based and doesn’t require installation of any native software. Users can access them it any web browser (Google Chrome is recommended) using their smartphone, tablet or a PC running any popular operating system (Mac, Linux, Windows, Android and iOS). The elements in the Oscilloscope & Signal Generator application are arranged logically and offer a familiar user interface.
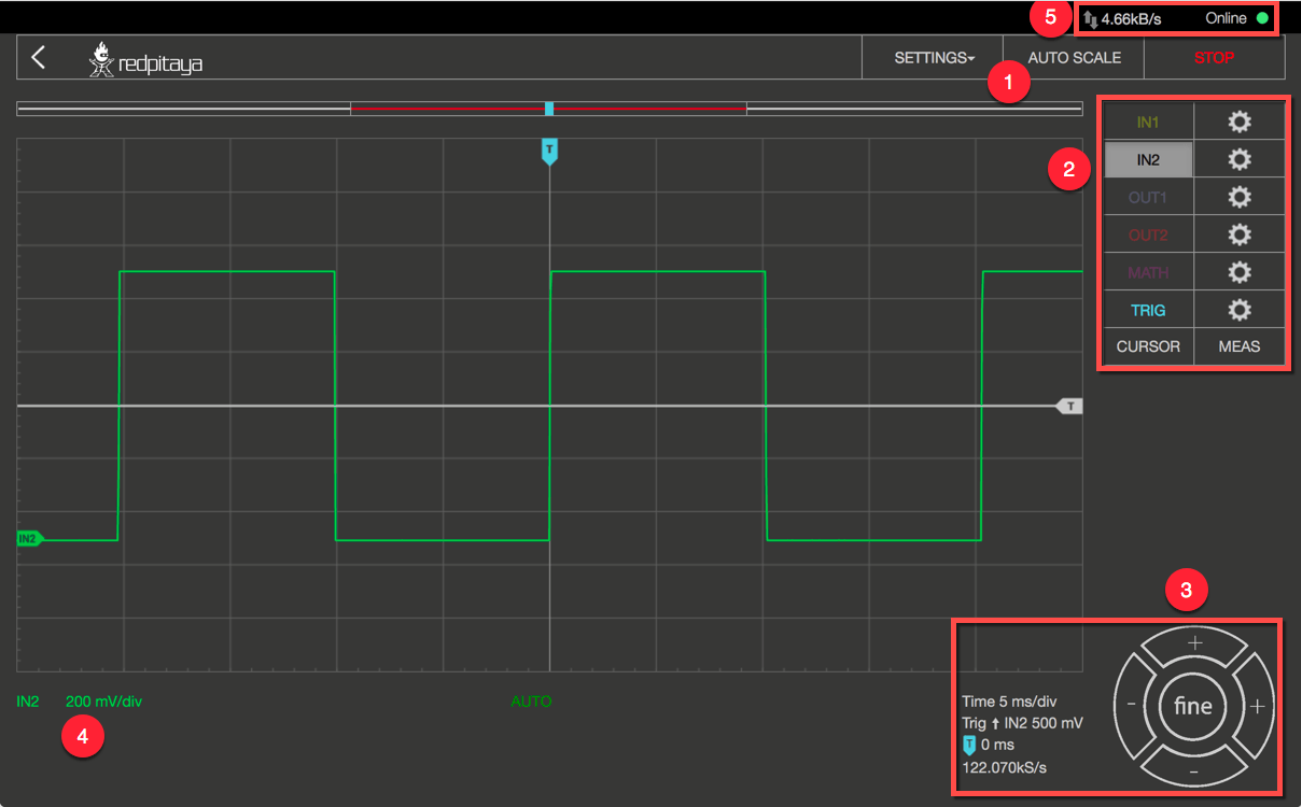
Apart from the graph, there are five areas in which the surface is divided:
- Autoscale: Automatically sets up the Oscilloscope settings for the optimal display of the input signals. By pressing the button the voltage axis and time axis are set so that at least one full period of the signal will fill the screen.
- Channels / Trigger / Measuring Tools: This menu provides controls for inputs / outputs, trigger, guides, and measurements.
- Axis control panel: By pressing the horizontal +/- buttons the scaling of the X-axis is changed and thus the selected time range which is displayed in the graph. The vertical +/- buttons change the Y-axis, and thus the displayed voltage range of the signal. In addition, the setting for the time frame, trigger, zero point of the X-axis and the sampling rate are displayed.
- Channel Setting display: Indicates the scale of the Y-axis for all channels that are switched.
Oscilloscope
| STEMlab 125-10 | STEMlab 125-14 | SDRlab 122-16 | SIGNALlab 250-12 | |
| Input channels | 2 | 2 | 2 | 2 |
| Bandwidth | 40MHz | 50MHz | 300kHz – 55MHz | 60MHz |
| Resolution | 10 bit | 14 bit | 16 bit | 12 bit |
| Memory depth | 16k samples | 16k samples | 16k samples | 16k samples |
| Input range | +/- 1V (LV) and +/- 20V (HV) | +/- 1V (LV) and +/- 20V (HV) | ± 0.5V /+4 dBm | ± 1V / ± 20V** |
| Input coupling | DC | DC | AC | DC/AC** |
| Minimal voltage sensitivity | ± 1.95mV / ± 39mV | ± 0.122mV / ± 2.44mV | ± 7.6uV | ± 0.488mV /± 9.76mV |
| External trigger | through extension connector | through extension connector | through extension connector | through BNC connector |
*Set by jumpers
**Set by software
Signal generator
| STEMlab 125-10 | STEMlab 125-14 | SDRlab 122-16 | SIGNALlab 250-12 | |
| Output channels | 2 | 2 | 2 | 2 |
| Frequency range | 0-50MHz | 0-50MHz | 300k – 55MHz | 0-60MHz |
| Resolution | 10 bit | 14 bit | 14 bit | 12 bit |
|
Signal buffer |
16k samples | 16k samples | 16k samples | 16k samples |
| Output range | +/- 1V | +/- 1V |
± 0.25V/-2dBm (into 50 ohm load) ± 0.5V/+4 dBm (into HI-Z load) |
± 1V / ± 5V (into 50 ohm load) ± 2V / ± 10V (into Hi-Z load)** |
| Input coupling | DC | DC | AC | DC |
| Output load | 50 Ω | 50 Ω | 50 Ω | 50 Ω |
*Set by jumpers
**Set by software5
The main features of the Oscilloscope & Signal Generator are listed below:
- Run/stop and auto set functionality
- Signal position and scale controls
- Trigger controls (source, level, slope)
- Trigger modes: auto, normal and single triggering
- Input calibration wizard
- Cursors
- Measurements
- Math operations
- Signal generator controls (waveform, amplitude, frequency, phase)
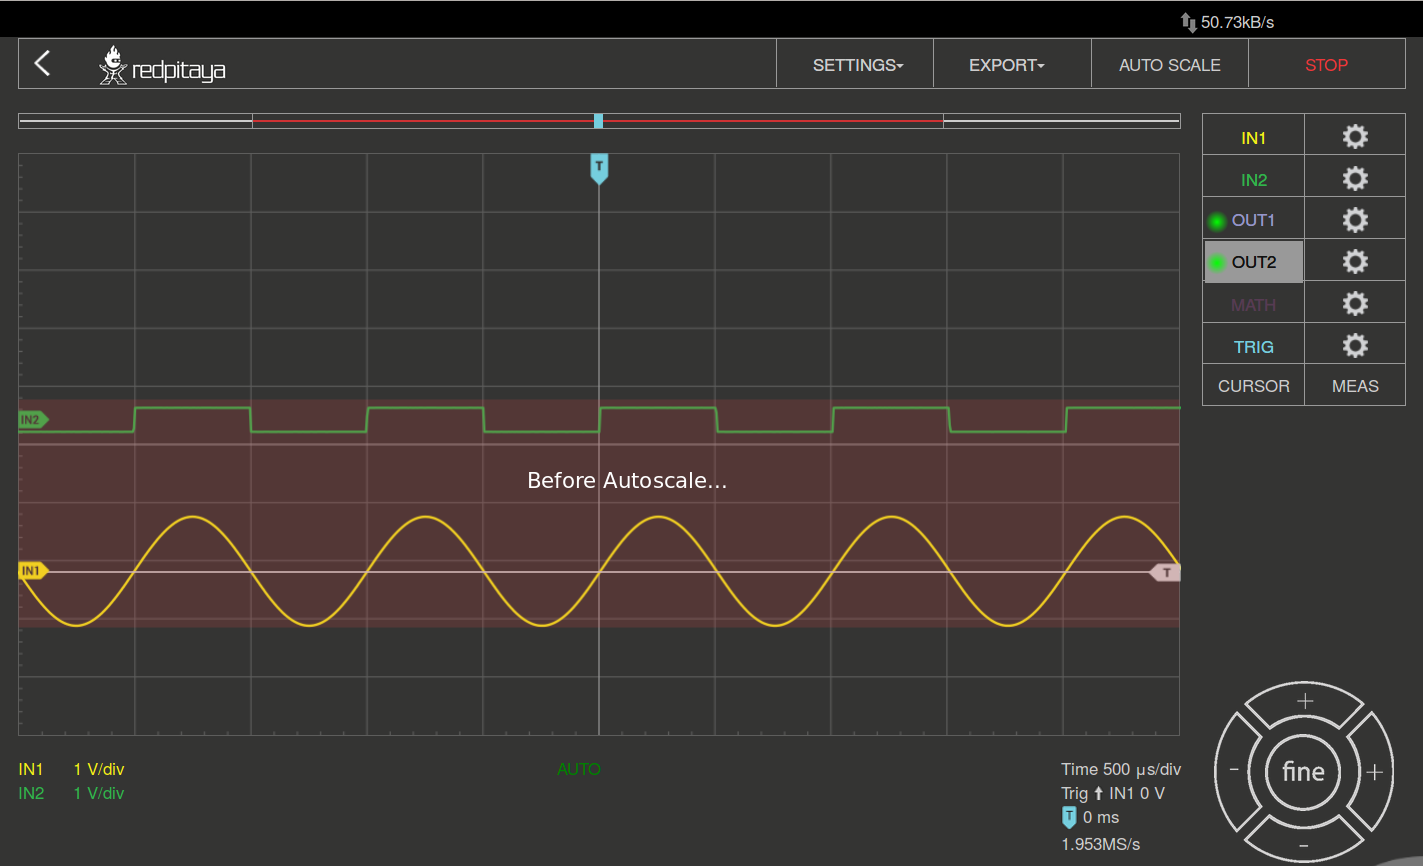
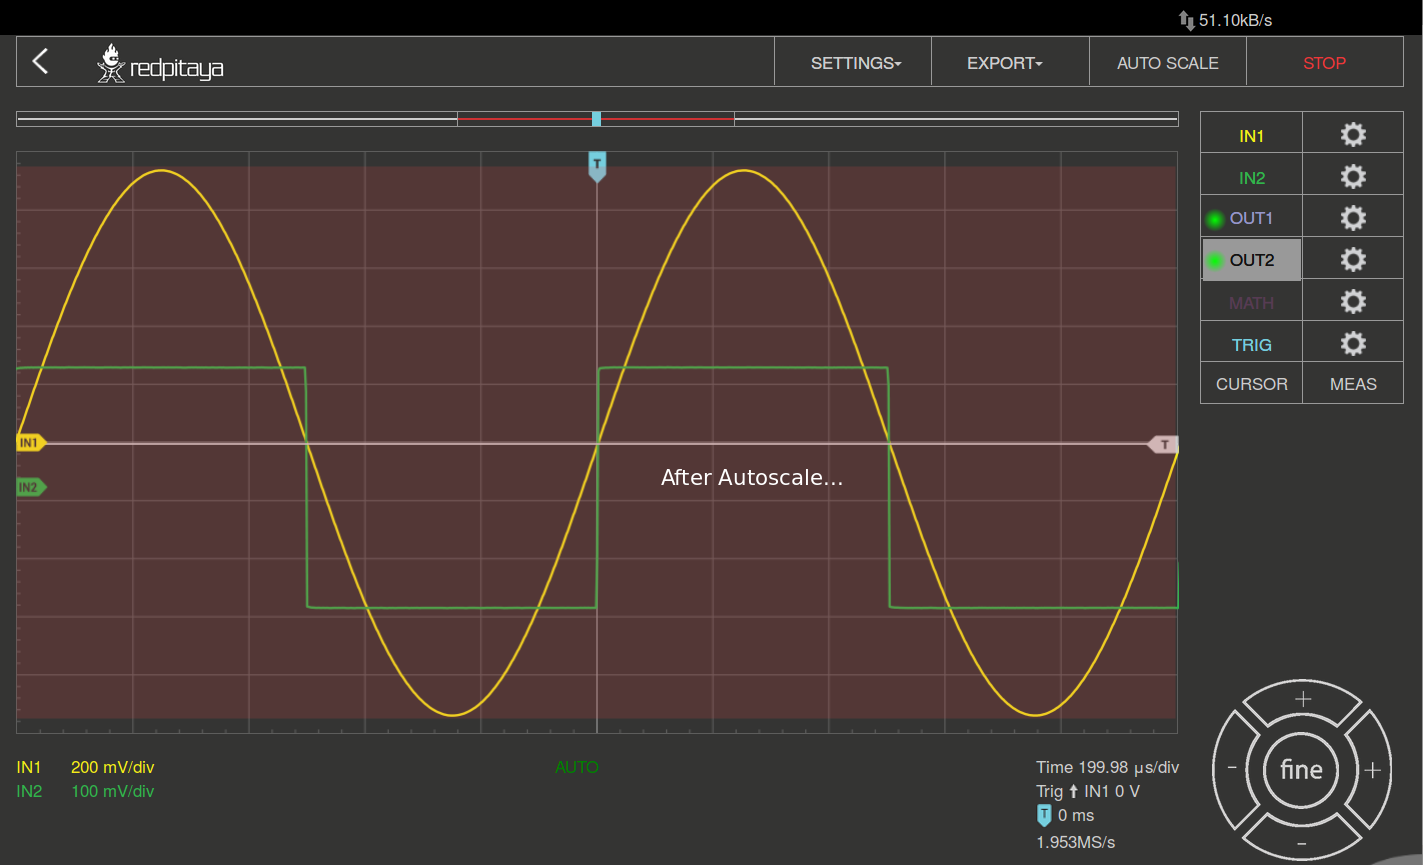
AUTOSCALE:
Automatically sets up the Oscilloscope to best display the input signal. By pressing this button, the voltage axis and time axis are set so that at least one full period of the signal will fill the screen.
INPUTS:
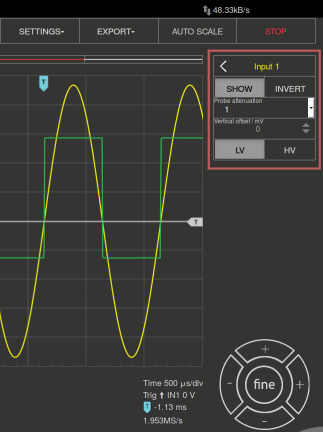
On the right side of the Oscilloscope & Signal Generator application interface the IN1 and IN2 channels are listed. With a simple click on the name of a channel (not the gear) the channel gets highlighted and you can easily control all the settings of the respective channel.
The available settings are:
- SHOW: Shows or hides the curve associated with the channel.
- INVERT: Reflects the graph on the X-axis.
- Probe attenuation: The division that was set on the probe (must be selected manually).
- Vertical offset: Moves the curve up or down.
- LV and HV: Must be selected acco
rding to the jumper position on each channel.
OUTPUTS:
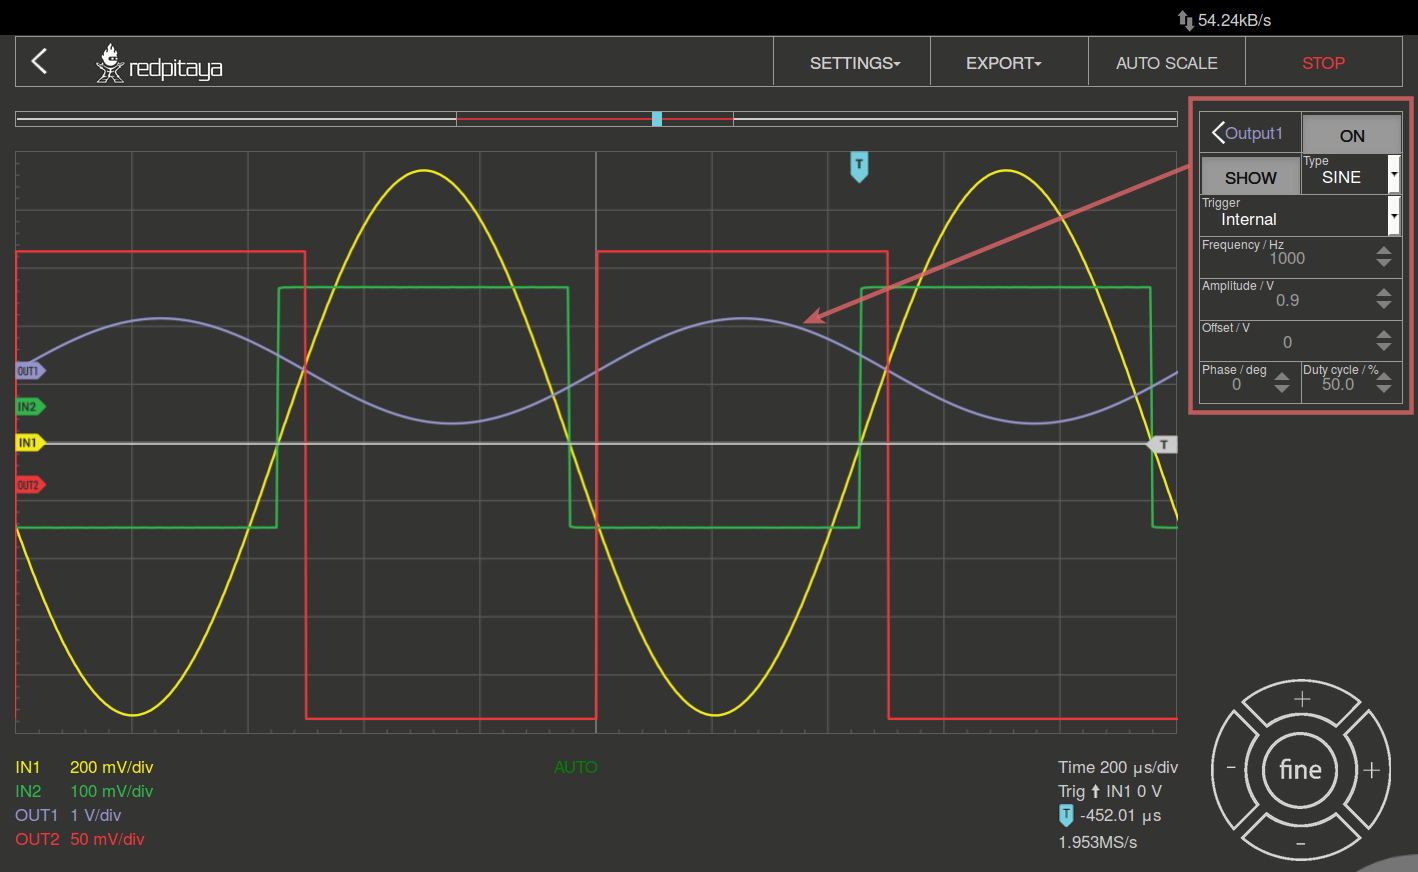
On the right side of the Oscilloscope & Signal Generator application interface the OUT1 and OUT2 channels are listed. By a simple click on the name of a channel (not the gear) the channel gets highlighted and you can easily control all the settings of the respective channel. The available settings are the following: ON, SHOW, Type, Trigger, Frequency, Amplitude, Offset, Phase, and Duty Cycle. Various waveforms are available for output: SINE (sinusoid), SQUARE (rectangle) TRIANGLE (triangle), SAWU (rising sawtooth), SAWD (falling sawtooth), DC and PWM (Pulse Width Modulation).
 TRIGGER:
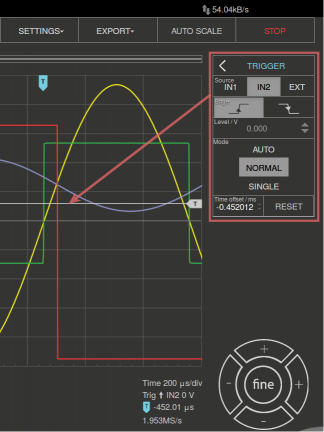
The trigger is used to enable the scope to display changing waveforms to be displayed on the screen of the scope in a steady fashion. The parameter Source defines the trigger source used for this. The trigger source can be input channel 1 (IN1), input channel 2 (IN2) or an external source. The available settings are the following:
- LEVEL
The trigger level value is used to determine at which value of signal amplitude the trigger condition will be satisfied (true). When the signal amplitude achieves/crosses this value the trigger state is set to “true”. Following the “true” trigger condition the acquisition and signal plotting will be executed. - EGDE
During the time sweep (acquisition) signal amplitude can cross the trigger level from a higher value to the lowest one or vice versa. The edge setting will determine at which case the trigger condition will be set to “true”. - NORMAL
The acquisition (trace (re)plotting) is executed only if the trigger state is “true”. In other words, the signal needs to satisfy the trigger condition in order to be acquired and (re)plotted by the Oscilloscope. - SINGLE
After the trigger conditions have been satisfied by the observed signal the acquisition is executed only once and trace re-plotting is stopped regardless of the repetitive “true” trigger states. - AUTO
The trigger state and conditions are disregarded. Signal acquisition and signal trace re-plotting are executed in a repetitive (continuous) manner. This is a default setting. - STOP
Pauses the triggers. - RUN
Starts/continues triggering.
The source parameter defines the source used for this purpose. With the IN1 or the IN2 the signal at the respective input is selected; with the EXT you can invoke the trigger from outside through Pin 3 on the header row E1.
MATH:
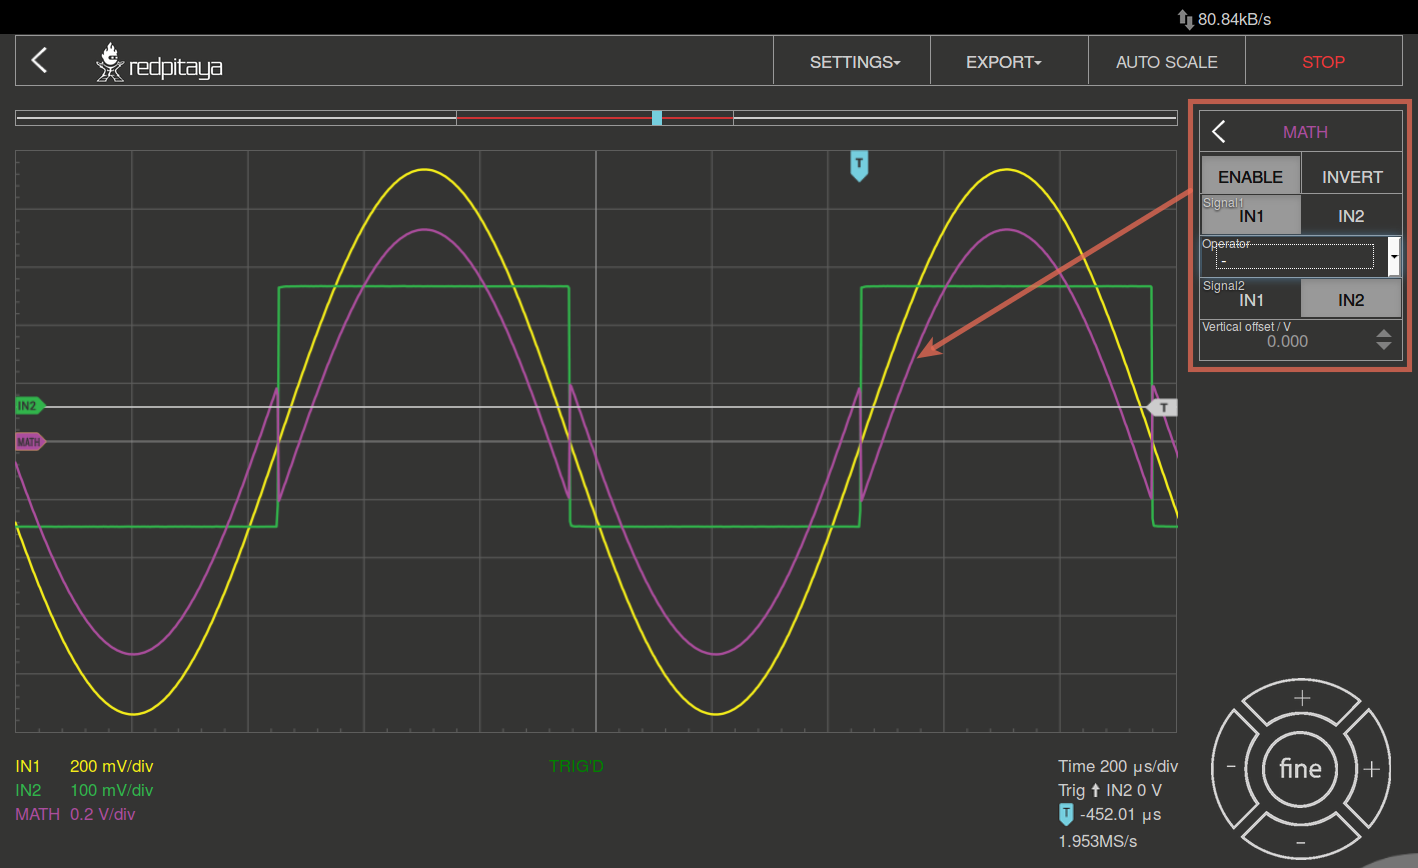
Among the more interesting features of a digital oscilloscope is the “math” channel. The following settings are available:
- + Adds the selected channels.
- – Subtracts the selected channels.
- * Multiplies selected channels.
- ABS Gives an absolute value of the selected signal.
- dy/dt Gives a time derivation of the selected signal.
- ydt Gives a time integration of the selected signal.
- INVERT Inverts the signal.
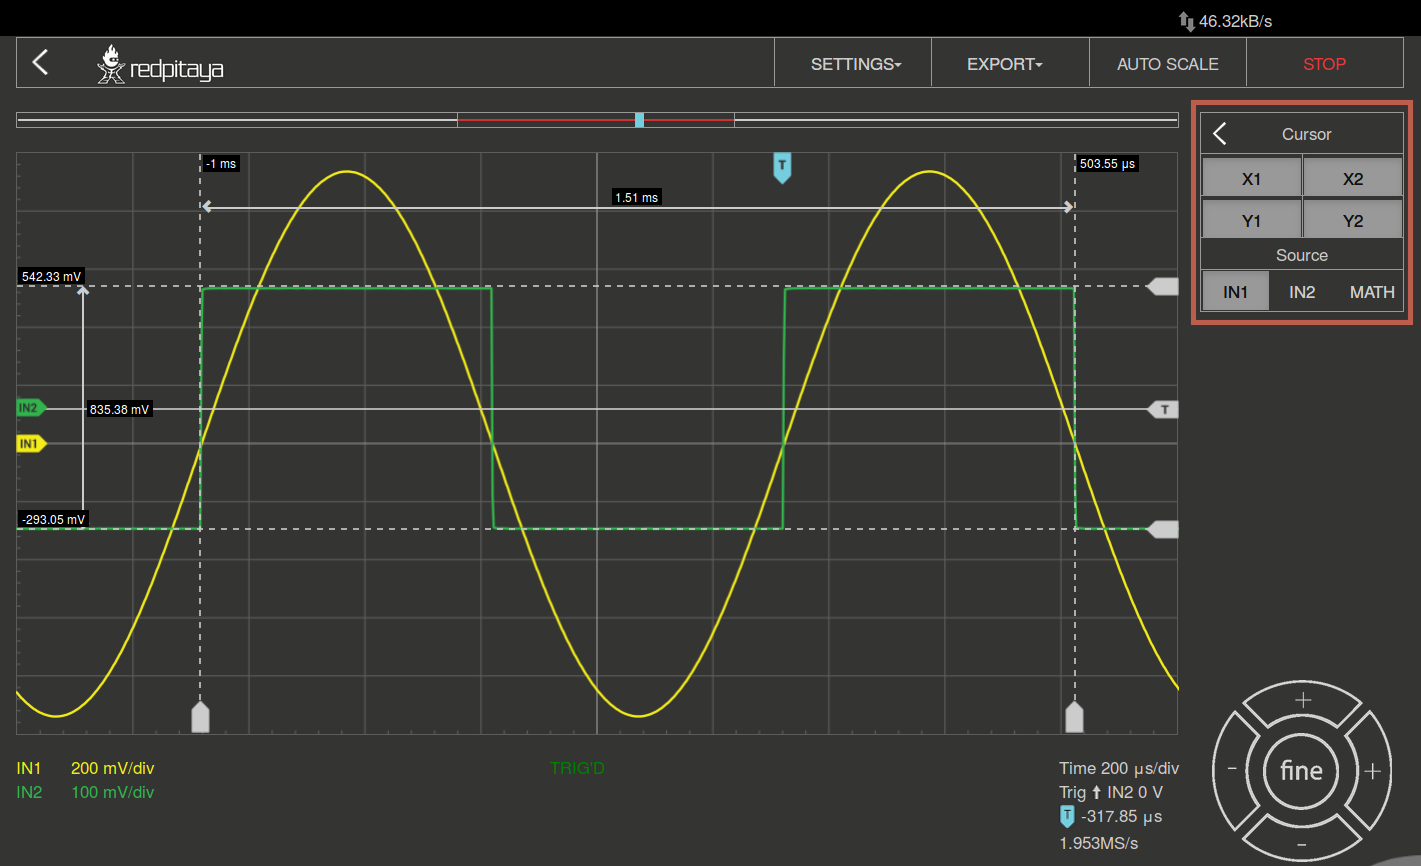
CURSOR
This feature enables the user to easily get the data of relevant basic measurements such as: signal period, amplitude, time delay, amplitude difference between two points, time difference between two points, etc.
NAVIGATE:
When you have a lot of data to analyze, it is very important to get through them easily. Navigate left and right by dragging the data where you want and effortlessly zoom in and out by using your mouse scroll wheel.
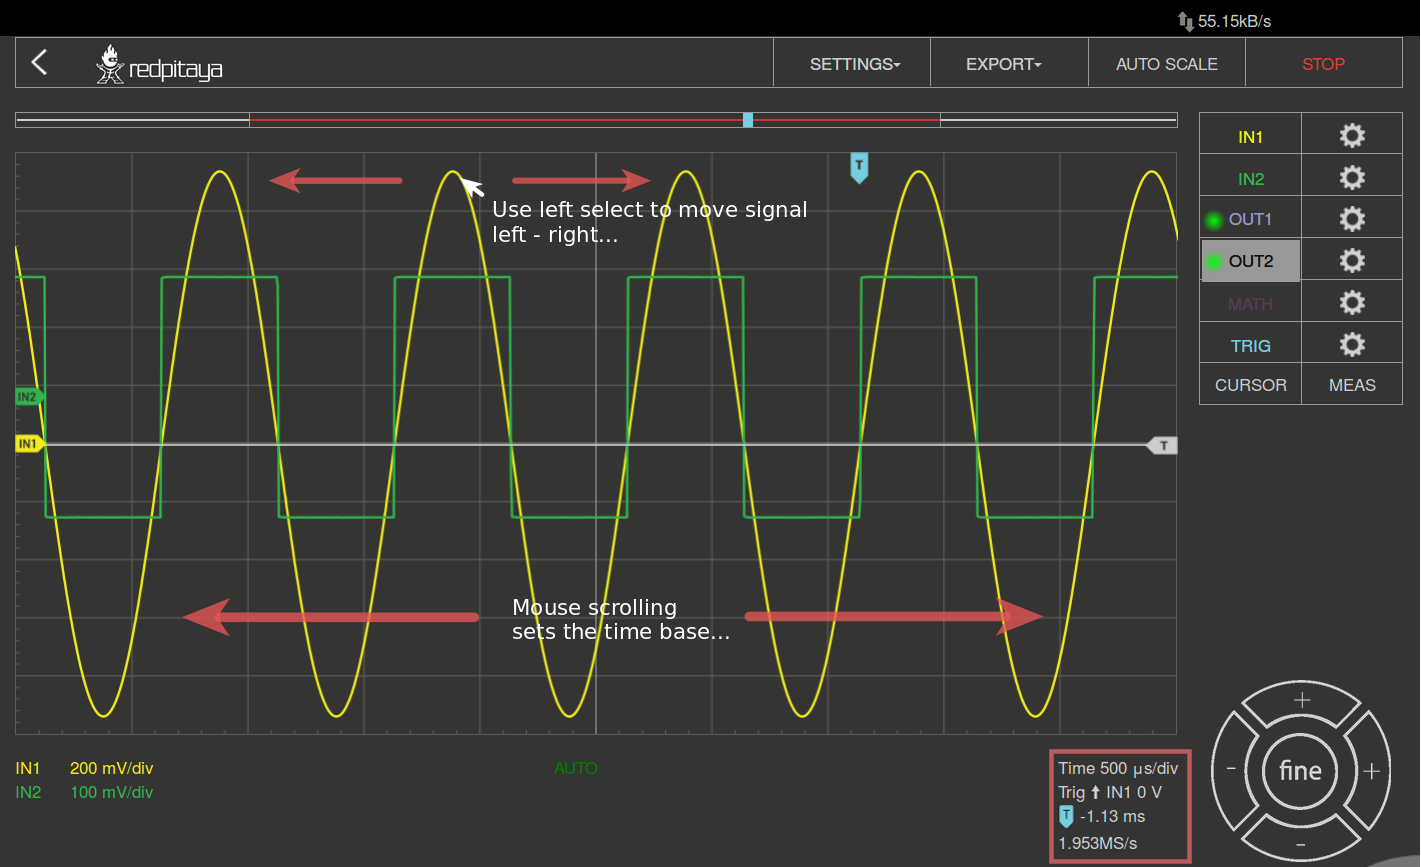
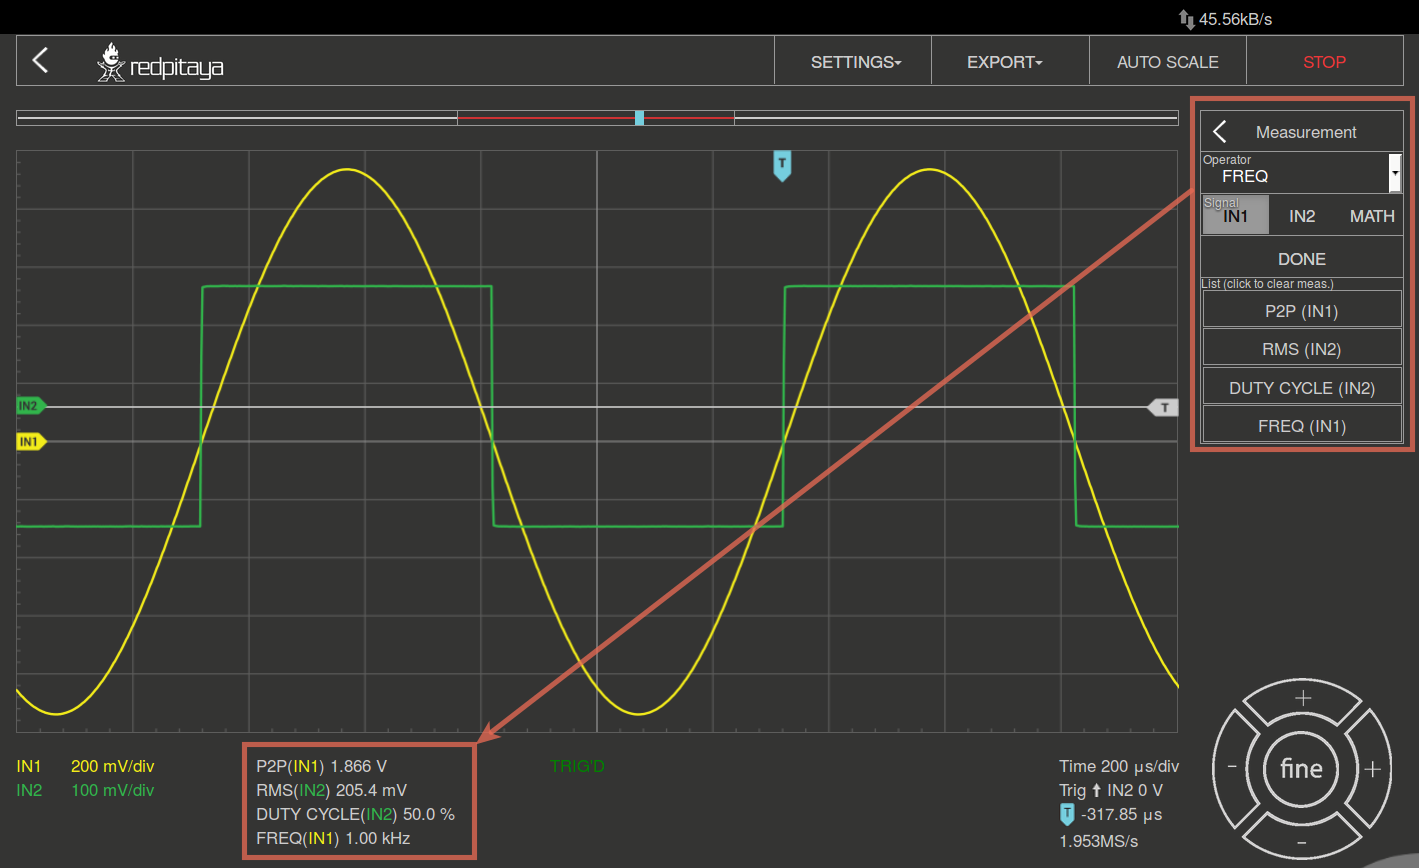
MEASUREMENTS:
The menu can be found under the MEAS button. Here you can select up to 4 measured values in total, then provide the corresponding values. In the operator field select the desired measurement and then set the signal from which channel the value should be taken. One click on DONE shows the value at the bottom of the channel settings. You may choose among the following:
P2P: The difference between the lowest and the highest measured voltage value. MEAN: The calculated average of the signal. MAX: The highest measured voltage value. MIN: The lowest measured voltage value. RMS: The calculated RMS (root mean square) of the signal. DUTY CYCLE: The signal’s duty cycle (ratio of the pulse duration and period length). PERIOD: Displays the period length, the time length of a vibration. FREQ: The frequency of the signal.
SHOP PRODUCTS
Development tools
The platform software is Open Source and available on Github. Device functionalities and data can be accessed through Matlab, Labview, Scilab and Python API’s.
LabView
Control STEMlab with LabVIEW - software designed for the fast development of any engineering application that requires test, measurement, or control.
MATLAB
Control your Red Pitaya with MATLAB - the easiest and most productive software environment for engineers and scientists. Perfect combination to speed up your research, prototyping and testing.
Jupyter / python
Jupyter notebooks is an open-source web application that combines live Python code, equations, visualizations, dashboards with real time graphs, dials, meters, sliders, buttons and explanatory text.
Explore Red Pitaya Resources
Our team constantly works on enriching our information base which makes your experience with Red Pitaya better. Check out the documentation, teaching materials and case studies and start your Red Pitaya journey!
Documentation
Find the information about getting started, more about applications and the developer's guide here.
Teaching materials
Explore our library of step-by-step examples, video tutorials and advanced FPGA excercises.
